Nike Business Model Canvas 2024
After revolutionizing athletic footwear with its iconic “swoosh” design in 1971, Nike has transformed into a global powerhouse that not only dominates sports apparel but also shapes athletic culture worldwide through innovative technology and powerful marketing campaigns. In this Nike Business Model Canvas, I will identify its customer segments, value proposition, revenue streams, channels, customer relationships, key activities, key resources, key partners, and cost structure.
Interesting fact!
The famous “Just Do It” slogan was inspired by the last words of convicted murderer Gary Gilmore, who said “Let’s do it” before his execution. Nike’s advertising executive Dan Wieden modified it slightly.
Movies About Nike: Air (2023)
Nike Competitors
Adidas | Puma | Under Armour | Reebok | ASICS | New Balance | Skechers | FILA | Converse
Customer Segments – Nike Business Model Canvas
Professional & Elite Athletes: Nike maintains strategic partnerships with top-tier athletes across various sports, from NBA superstar LeBron James to tennis champion Naomi Osaka, investing approximately $1.1 billion annually in athletic endorsements as of 2023.
Fitness Enthusiasts & Amateur Athletes: Through their Nike Training Club app, which garnered over 15 million downloads in 2023, Nike targets dedicated fitness enthusiasts who seek premium performance wear and specialized equipment for their training regimens.
Urban Youth & Fashion-Forward Consumers: By collaborating with influential designers and artists like Travis Scott and Virgil Abloh, Nike has captured the streetwear market, with their sneaker collaborations generating over $5 billion in revenue during 2023.
Health-Conscious Individuals: Through their expanded athleisure line and digital fitness platforms, Nike caters to wellness-focused consumers aged 25-40, who prioritize both functionality and style in their everyday athletic wear, contributing to a 40% growth in their lifestyle category.
Team Sports Organizations: Nike dominates the team sports segment by supplying uniforms and equipment to major leagues worldwide, including exclusive partnerships with the NFL and over 75% of NBA teams, generating substantial B2B revenue streams.
Value Proposition – Nike Business Model Canvas
Innovation in Performance Technology: Through groundbreaking developments like the self-lacing Nike HyperAdapt and ZoomX foam technology, Nike consistently delivers cutting-edge performance solutions, investing over $2 billion in research and development during 2023 to enhance athletic capabilities.
Premium Brand Identity: By maintaining exclusive partnerships with elite athletes and leveraging sophisticated marketing campaigns, Nike has established itself as a premium lifestyle brand, commanding a 27% global market share in athletic footwear while maintaining premium pricing strategies.
Customization & Personalization: Nike’s By You platform, which allows customers to design personalized products, experienced a 30% growth in 2023, offering over 100,000 customization possibilities across their product range while maintaining premium quality standards.
Sustainable Innovation: Through their Move to Zero initiative and the introduction of Nike Forward technology, which reduces carbon footprint by 75%, Nike demonstrates their commitment to sustainability while meeting increasing consumer demand for eco-friendly products.
Digital Integration & Experience: Nike’s ecosystem of apps and digital platforms, including SNKRS and Nike Training Club, has amassed over 300 million members globally, offering personalized shopping experiences and workout guidance while driving direct-to-consumer sales.
Revenue Streams – Nike Business Model Canvas
Direct-to-Consumer Sales: Nike’s digital and retail sales through owned channels, including Nike.com and retail stores, generated $18.7 billion in 2023, representing a 17% increase year-over-year, while their membership program drove 50% of digital sales.
Wholesale Distribution: Despite shifting towards direct sales, Nike maintains strategic partnerships with major retailers like Foot Locker and Dick’s Sporting Goods, which contributed approximately $25.4 billion to their revenue in 2023, representing 58% of total sales.
Licensing & Royalties: Through strategic licensing agreements for Nike-branded products and technology patents, including partnerships with Converse and Hurley, Nike generated over $1.2 billion in licensing revenue while maintaining brand control and quality standards.
Equipment & Accessories: Beyond footwear and apparel, Nike’s equipment segment, including balls, bags, and digital devices, contributed $1.4 billion to revenue in 2023, demonstrating strong growth in complementary product categories.
Global Market Diversification: International sales across Europe, Asia Pacific, and emerging markets accounted for 61% of Nike’s total revenue in 2023, with China alone contributing $8.3 billion despite market challenges.
Channels – Nike Business Model Canvas
Digital Commerce Platforms: Nike’s digital ecosystem, encompassing Nike.com and the SNKRS app, achieved record-breaking sales of $13 billion in 2023, while their mobile apps demonstrated a 45% increase in engagement through personalized shopping experiences and exclusive product launches.
Owned Retail Stores: Operating over 1,000 retail locations globally, Nike’s physical stores generated $9.5 billion in revenue during 2023, incorporating digital integration through Nike Rise concept stores that blend physical and digital experiences while offering personalized services.
Strategic Retail Partners: Despite reducing wholesale partners by 50% since 2021, Nike maintains premium partnerships with select retailers like JD Sports and Foot Locker, which contribute significantly to their global distribution network while maintaining brand positioning.
Social Media & Digital Marketing: Leveraging a robust social media presence across platforms, Nike reaches over 450 million followers globally, while their marketing campaigns achieve unprecedented engagement rates of 4.5% across Instagram and TikTok.
Nike Apps Ecosystem: Through their suite of apps including Nike Training Club, Nike Run Club, and Nike Fit, which collectively reached 300 million users in 2023, Nike creates personalized connections while gathering valuable consumer data.
Customer Relationships – Nike Business Model Canvas
Membership Program & Personalization: Nike’s membership program, which surpassed 300 million members in 2023, delivers personalized product recommendations and exclusive access to launches, resulting in members spending three times more than non-members while demonstrating higher brand loyalty.
Digital Community Building: Through Nike Run Club and Training Club apps, which facilitated over 500 million workouts in 2023, Nike fosters a global fitness community while providing personalized coaching and connecting users through challenges and shared achievements.
Customer Service Excellence: Nike’s omnichannel customer service, enhanced by AI-powered chatbots and virtual try-ons, maintains a 92% satisfaction rate while handling over 50 million customer interactions annually through various touchpoints.
Athlete Partnerships & Inspiration: By maintaining relationships with over 10,000 athletes globally and investing in grassroots sports programs, Nike creates aspirational connections with consumers while supporting athletic development at all levels.
Sustainable Consumer Engagement: Through initiatives like Nike Refurbished and Nike Grind, which recycled 130 million pounds of materials in 2023, Nike builds meaningful relationships with environmentally conscious consumers while demonstrating commitment to sustainability.
Key Activities – Nike Business Model Canvas
Product Design & Innovation: Nike’s innovation teams, supported by a $2.1 billion R&D budget in 2023, develop breakthrough technologies like the Nike Forward platform and Flyknit technology while maintaining 14 research labs globally and filing over 1,000 patents annually.
Supply Chain Management: Through their Triple Double Strategy, Nike has optimized their supply chain with AI-driven demand forecasting and robotics implementation across 175 factories in 15 countries, reducing production time by 50% while maintaining quality standards.
Digital Transformation: Nike’s ongoing digital transformation, which received a $1.5 billion investment in 2023, focuses on enhancing their connected inventory system and developing AI-powered customer experiences, resulting in a 40% increase in digital sales efficiency.
Marketing & Brand Management: Through strategic partnerships and digital marketing initiatives, Nike invested $3.9 billion in brand marketing in 2023, maintaining partnerships with 50 professional sports leagues and generating 7 billion monthly social media impressions.
Sustainability Operations: Nike’s Move to Zero initiative encompasses innovative manufacturing processes and sustainable material development, with 78% of all Nike products now containing some recycled material while reducing carbon emissions by 70% in owned facilities.
Key Resources – Nike Business Model Canvas
Intellectual Property Portfolio: Nike’s extensive IP assets include over 40,000 patents and trademarks globally, while their proprietary technologies like Flyknit and ZoomX, protected by robust legal frameworks, generate significant competitive advantages and licensing revenues.
Manufacturing Infrastructure: With a network of 175 contracted factories across 15 countries and state-of-the-art automation systems, Nike’s manufacturing capabilities produce over 900 million units annually while maintaining quality control through AI-powered inspection systems.
Digital Technology & Data Assets: Nike’s technological infrastructure, powered by cloud computing and AI algorithms, processes over 5 billion customer data points daily, while their suite of apps and digital platforms serves 300 million active users globally.
Brand Equity & Partnerships: Valued at $50.3 billion in 2023, Nike’s brand portfolio includes strategic partnerships with elite athletes and teams, while their iconic swoosh logo maintains 97% global recognition and drives premium pricing power.
Human Capital: Nike’s workforce of 79,000 employees includes specialized innovation teams, digital experts, and designers, while their Advanced Innovation Team, comprising 1,000 scientists and engineers, drives technological breakthroughs from 14 research facilities worldwide.
Key Partners – Nike Business Model Canvas
Manufacturing Partners: Nike collaborates with 195 specialized factories across Southeast Asia and Latin America, with Vietnam accounting for 51% of footwear production and Indonesia contributing 24%, while implementing advanced technology sharing and sustainable manufacturing practices.
Athletic Organizations & Teams: Through exclusive partnerships with major leagues including the NFL, NBA, and over 20 national soccer teams, Nike maintains dominant market presence while generating $5.1 billion from professional sports merchandising and licensing agreements.
Technology & Innovation Partners: Strategic alliances with tech companies like HP (for 3D printing), Apple (for wearables), and Nvidia (for AI implementation) enable Nike to advance their digital transformation while developing cutting-edge product innovations and customer experiences.
Retail Distribution Partners: Despite streamlining their wholesale network, Nike maintains premium partnerships with strategic retailers like Foot Locker and JD Sports, which collectively operate 5,000+ locations globally while maintaining brand positioning and customer experience standards.
Sustainability Collaborators: Nike partners with organizations like Sustainable Apparel Coalition and innovative material suppliers, investing $1.2 billion in sustainable technologies while working with 40 research institutions to develop eco-friendly materials and processes.
Cost Structure – Nike Business Model Canvas
Manufacturing & Production Costs: Nike’s cost of goods sold reached $21.8 billion in 2023, representing 55% of revenue, while raw material costs and labor expenses in their global manufacturing network account for the largest portion of operational expenses.
Marketing & Advertising Expenditure: With an annual marketing budget of $3.9 billion, Nike invests heavily in digital advertising, athlete endorsements, and brand campaigns, while their sponsorship agreements with major sports leagues command premium investments of $1.1 billion annually.
Research & Development Investment: Nike allocates $2.1 billion to R&D initiatives across their 14 innovation centers, while maintaining specialized teams of engineers and scientists who focus on developing breakthrough technologies and sustainable materials.
Digital Infrastructure & Technology: Investing $1.5 billion in digital transformation initiatives, Nike maintains cloud computing infrastructure, AI development, and e-commerce platforms, while implementing advanced analytics systems across their global operations network.
Supply Chain & Logistics: Operating costs for Nike’s global supply chain, including transportation, warehousing, and inventory management, amount to $3.2 billion annually, while implementing automated systems and AI-driven optimization reduces operational inefficiencies.
Summary of Nike Business Model Canvas
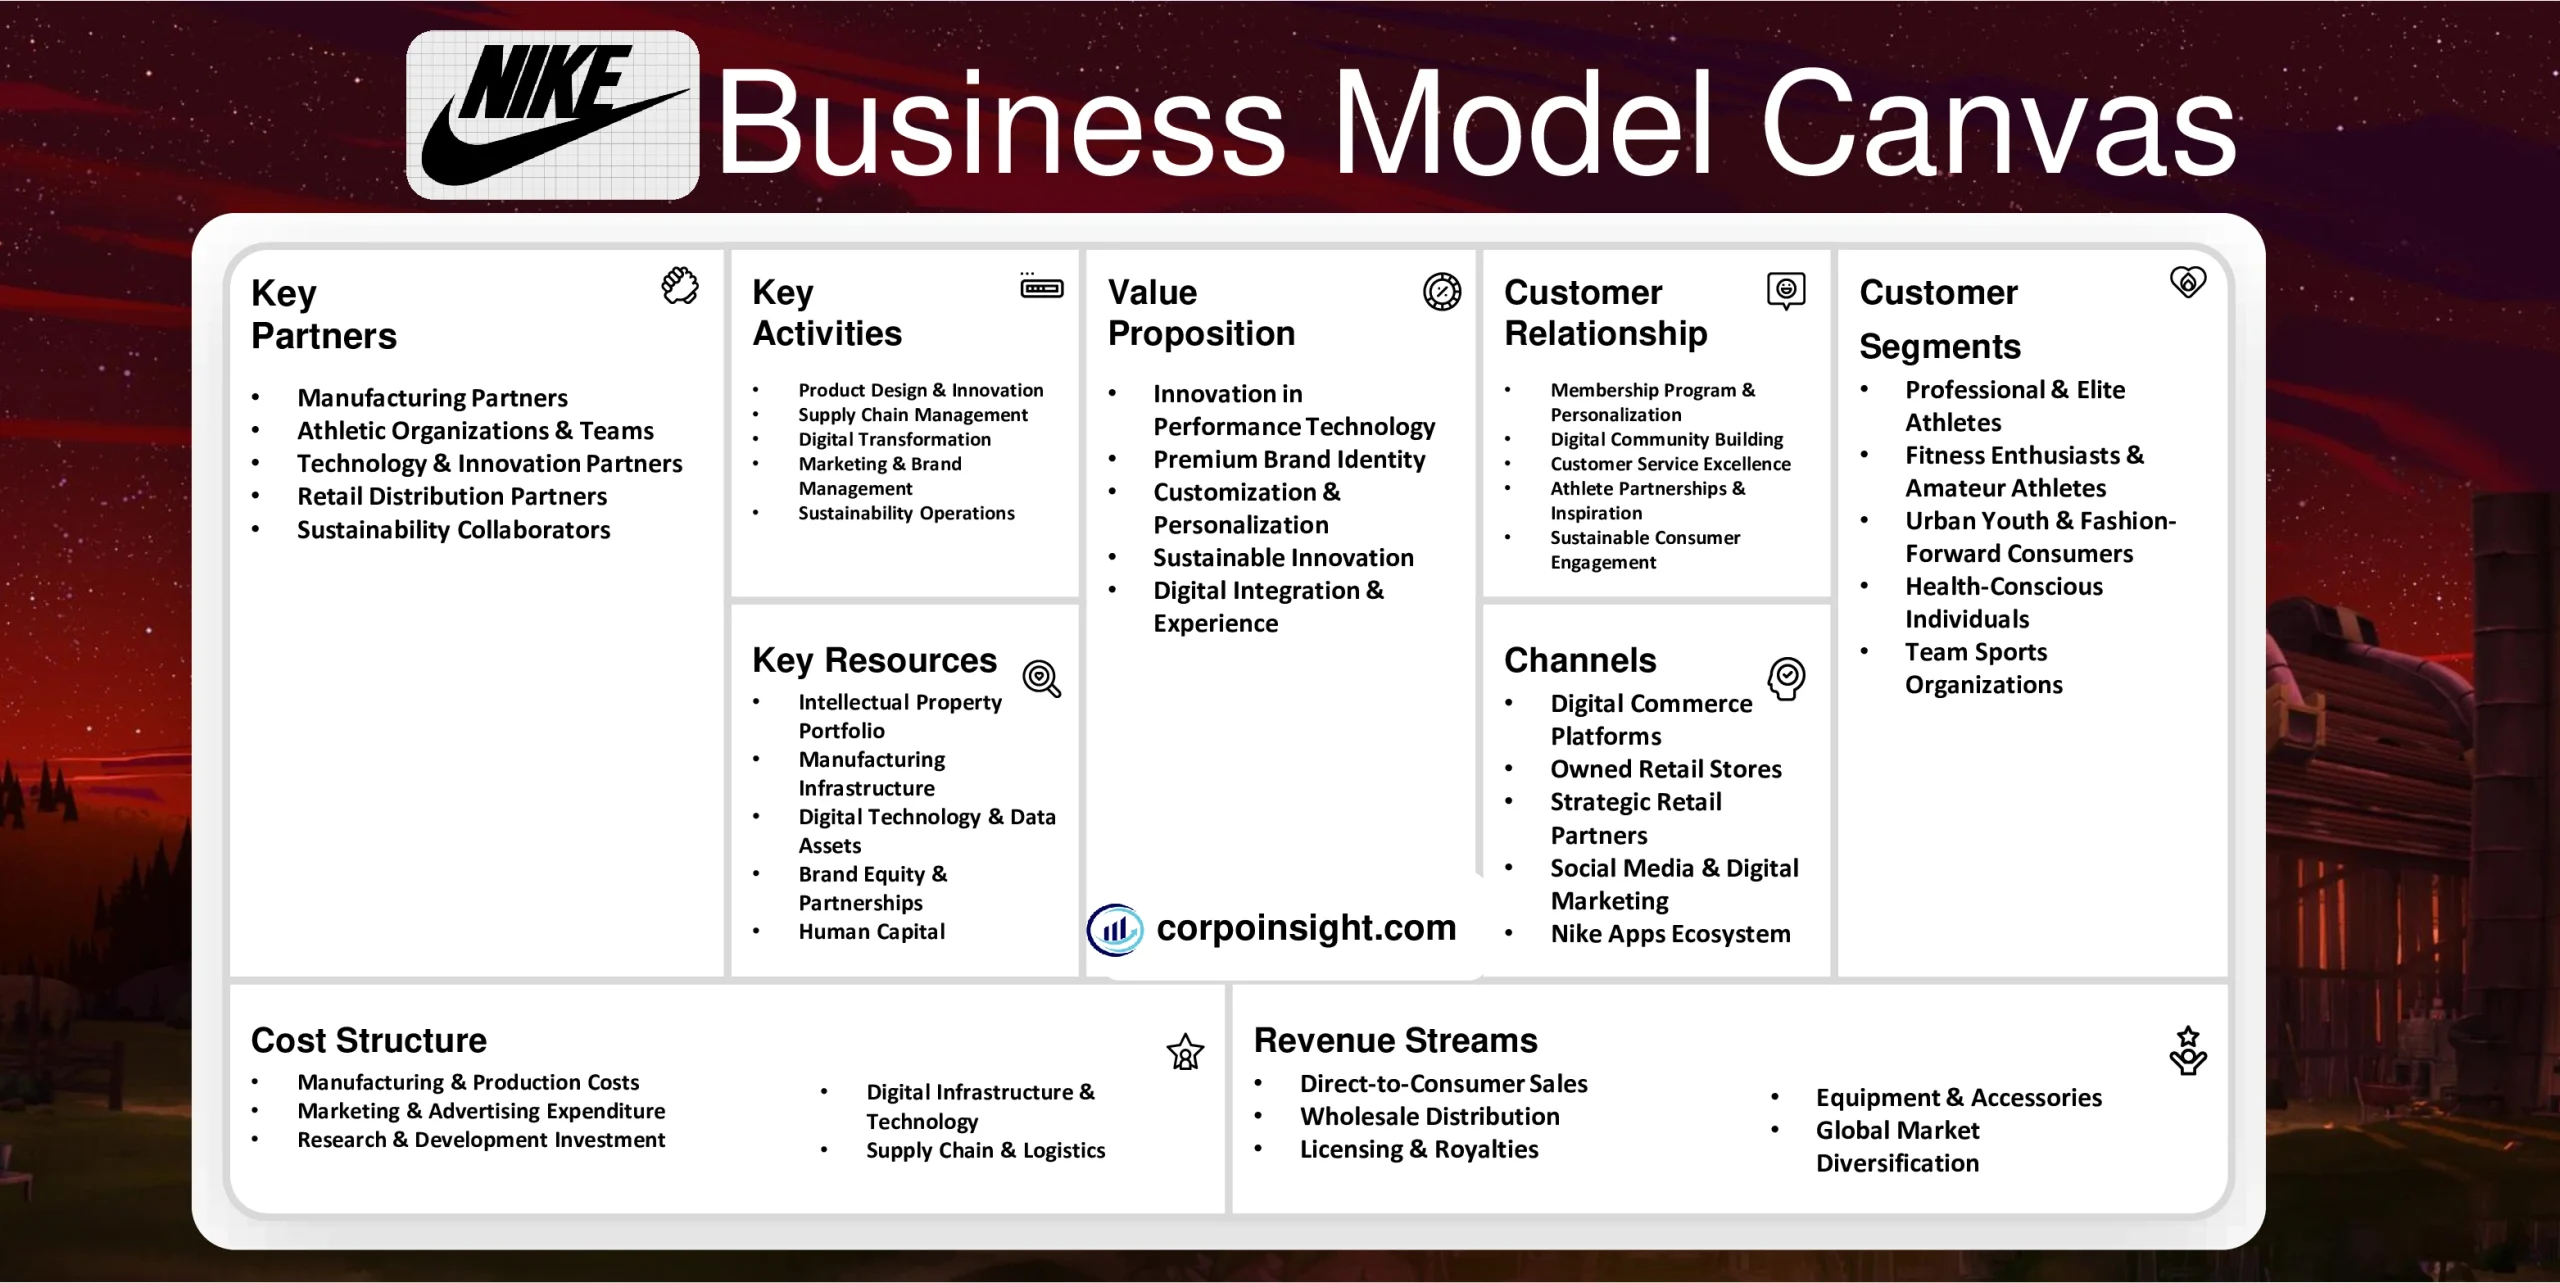
Conclusion on Nike Business Model Canvas
Nike’s business model canvas demonstrates a robust ecosystem that seamlessly integrates innovation, digital transformation, and brand supremacy. Through strategic partnerships, sustainable practices, and customer-centric approaches, Nike maintains its market leadership while generating substantial revenue streams. Their focus on direct-to-consumer channels, supported by strong digital infrastructure and premium brand positioning, continues to drive growth while adapting to evolving consumer preferences and market dynamics.

This is Ahsanul Haque, someone very passionate about digital marketing, SEO, and Data Analytics and founder of the Analytics Empire and currently pursuing my major in marketing at Bangladesh University of Professionals.

